I'm processing a set of multispectral images acquired with the M350 + MICASENSE RedEdge-p. After processing, I'd like to export the individual bands (red, blue, green, NIR, REDEDGE) as separate TIFF files. Do you have any suggestions? The software only lets me export a single TIFF file with four bands, but I don't know how to assign the correct band to each one.
Thank you very much
How export individual bands from a multispectral data
8 Replies

You can use a software like QGIS (qgis.org) to open the resulting orthophoto and split/export the bands however you like
Best answer
Just make sure to export as Raw GeoTIFF from WebODM. This is often dismissed.
👍 2
OP
Hi! I exported the orthophoto as you recommended and separated the bands within it. I have two questions:
- Why do I have 7 bands when my Micasense sensor has 6? (Blue, Green, Red, NIR, RedEdge, and Pan).
- How can I tell which file corresponds to which band? For example, which single band is Split 1 linked to?
Thank you
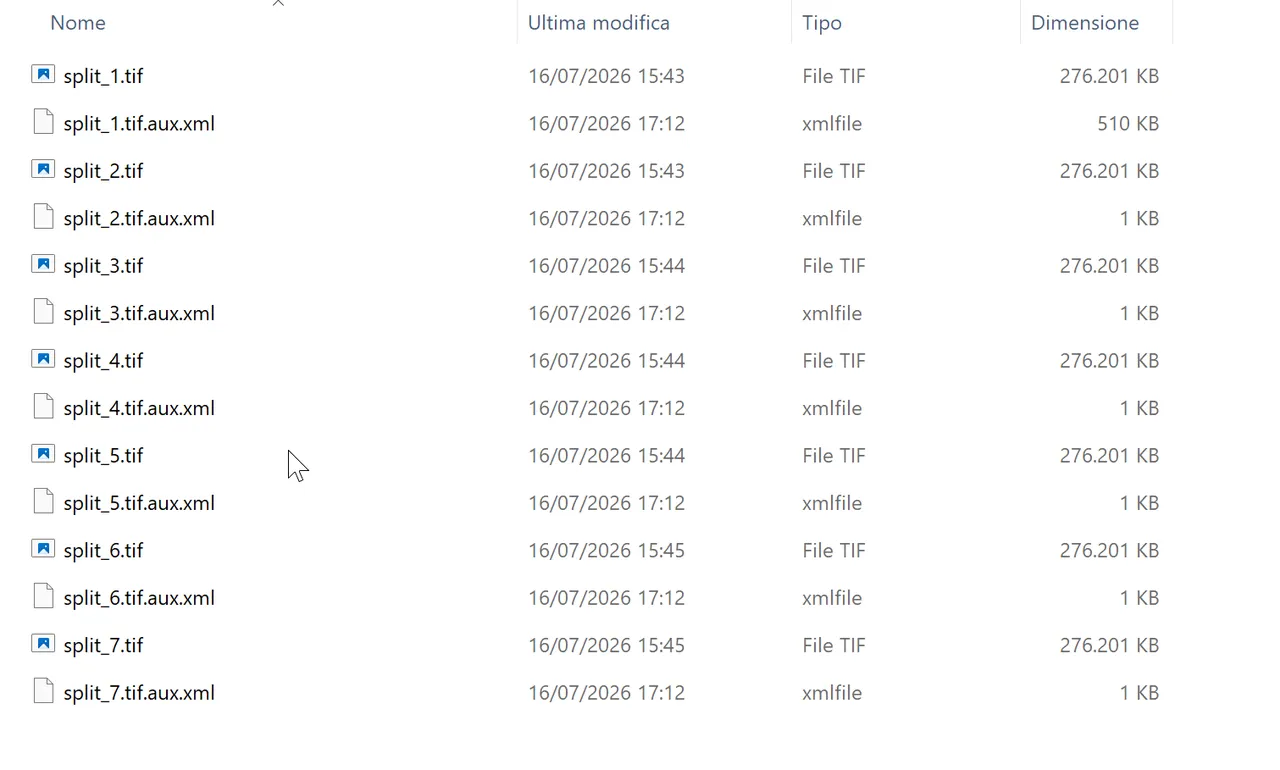
Hi Matteo. 7 bands is perfectly fine. The seventh band is an alpha-layer.
1 Blue 475 nm
2 Green 560 nm
3 Red 668 nm
4 Red Edge 717 nm
5 NIR 842 nm
6 Panchromatic 634,5 nm
7 alpha
edit: Piero is right. band 7 is for alpha.
The last band is (should be?) a transparency (alpha) band. Tells you were valid pixels are.
OP
Thank you so much for the advice. I have one last question: when I open the orthophoto in QGIS—which already contains all the channels (downloaded directly from WEBodm)—it automatically classifies the various bands as shown in the screenshot I uploaded. This is an automatic assignment, and I shouldn’t trust it, right? Should I follow the band sequence you recommend. Thanks!
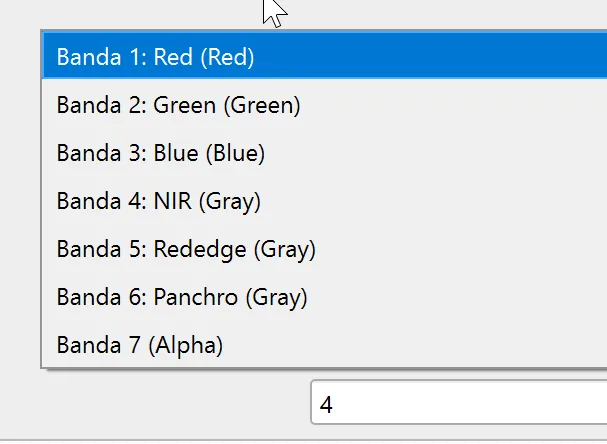
Trust, but verify
Just to clarify, the band order from my previous post is from the MicaSense operation manual. In addition, since WebODM does not compute pan-sharpening from the panchromatic band, you can ignore that band (6) anyway. If you are unsure about band order / classification, you might want to validate it by using the value tool in QGIS hovering above vegetation on the image. The band that jumps up the most (compared to bare soil) is NIR. The band right below it in wavelength is RedEdge. The band that is low over vegetation but higher over bare soil is RED.
Need more help?
This discussion happened in the WebODM community Discord. Join and ask your own question.
Join View Original ThreadThis page mirrors a public discussion from the WebODM Discord. How to request a removal.